


Thanks to technological advances applied in the industry of People Counting, today not only can you count the number of people entering a space, but can know the gender, age range and even perform a complete follow-up of the course and behavior of the client to the interior of the shops.
“What is not measured, it is not controlled. What you do not control you can't measure” – Thomson, W. K.
In other words, the more information you have about the operation of our stores, the more control we will have over the daily management and performance of the same.
VISION COMPUTATIONAL
The technology that we are using in our projects use intelligent algorithms to do a full follow-up to the client to the interior of the shops. Basically, this technology behaves like the human eye, and allows us to interpret the images received by devices to be able to recognize people and objects.
This is achieved through cameras connected to a server “smart” capable of processing videos, and deliver information according to the algorithm that has been selected to analyze and train, becoming a neural network machine learning.
PILOT CASE
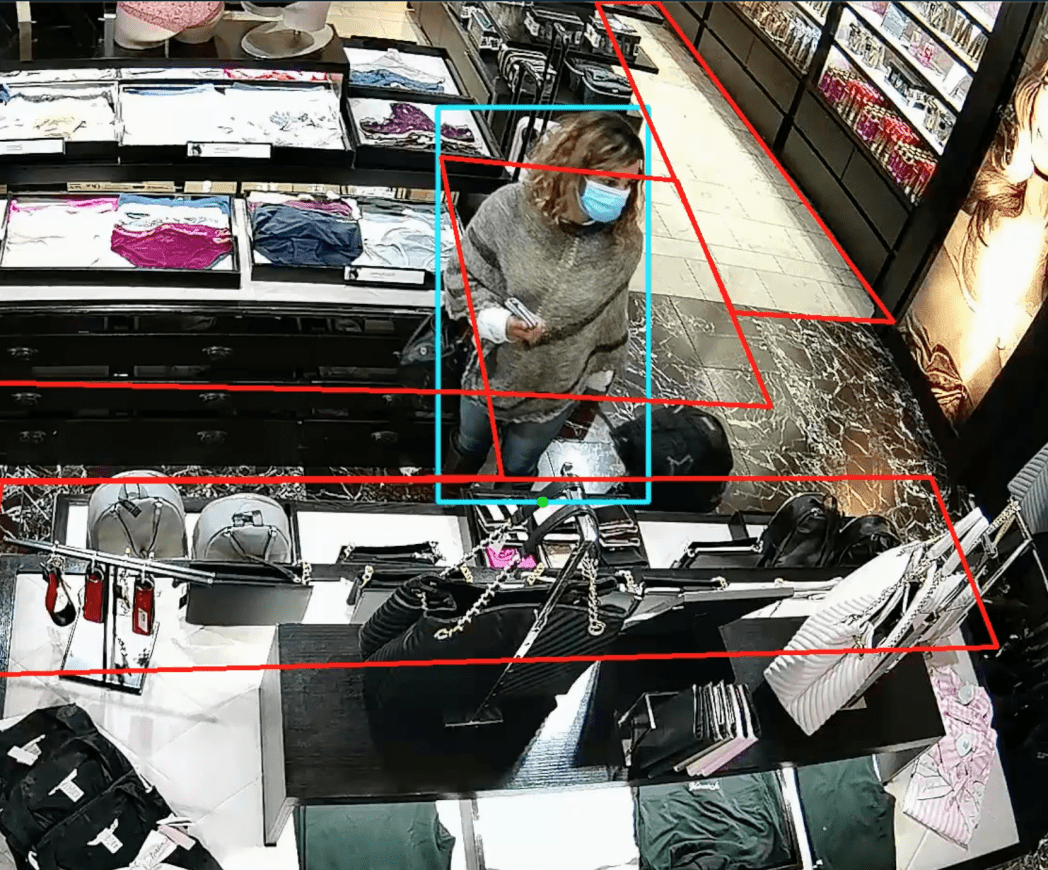
Below, I present a case that we apply in a shop of the Group of Saint Honoré. What I was looking for this shop was to optimize its performance (increasing their conversion and salesthrough the interactions between customers and sellers.
To measure these interactions, we implemented the technology of computer vision to the interior of the store (cameras + server) using an algorithm that is able to recognize and differentiate the vendors of the customers.

VARIABLES
From the information gathered, we created two new variables fundamental to get the findings sought by the customer, these include:
- Optimal time of interaction: interval duration at the interaction vendor – client, where it is more likely to produce a purchase (in seconds).
- Number of interactions: number of total interactions and the seller.
In addition to these two new variables, we used some KPIs for the traditional management of the store as your traffic journal, conversion and number of sellers.
HYPOTHESIS
Given that this was an analysis completely innovative, it was necessary to validate different scenarios that would deliver recommendations robust, which are mentioned below:
- To determine whether there is a relationship between the duration of interactions (seconds), and a higher probability of in-store purchase (conversion).
- If there is a relationship between the two variables (hypothesis 1), then it would have to find what is the optimal interval of the duration of the interactions.
- Find out if there is a relationship between the amount of total interactions (and seller), and a higher probability of in-store purchase (conversion).
ANALYSIS – FINDINGS
As a first finding, we found that 80% of the interactions had a length of up to 35 seconds, so it was decided to use 10-second intervals to obtain representative results.
From this, we studied the relationship between the duration of the meeting and the conversion of the store, getting that if there was a greater correlation between the two variables in three of the nine intervals:

Therefore, if there is a strong correlation (top 50%) in the interactions that last from the 20 to 50 seconds. Therefore, for this shopthe “Interactions of value” will be those that duration.
Why do a special emphasis that is only for this shop and not for the entire string Group Saint Honoré?
The optimal time of interactionshows the range that it is more likely that the customer will make a purchase, therefore, the interval can vary depending on the demographics of the customer.
Consequently, this optimum will vary depending on the type of industry and of the products offered (because the client will have a specific behavior depending on the type of purchase), obtaining an optimal different for each store.
Once it has found the optimal duration of an interaction, we investigated whether a relationship existed between the amount of approaches to the client, and the conversion of the shop.
The correlation between the rate of interactions and the conversion of the store (using the rates and not the numerical values integers to achieve the isolation of the effect of the traffic of this correlation, that is to say, we used the rate of interactions in time of the number of interactions and the conversion of the store instead of the buyers).

As shown in the top graph, it was determined that the higher the rate of interactions, the higher will be the conversion in the store. That is to say, the more you interact with sellers with customers, the store will get a better performance.
If you replicate this same analysis in different intervals of duration, it is obtained that the correlation increases when using the samples between 20 to 50 seconds.
That is to say, independent of when it is the duration of the interaction is always going to be better interact with the client, but if, in addition, the board takes between 20 to 50 seconds, it is even more likely to produce a purchase.
Finally, we replicated the same methodology as above, but this time we used individual interactions by seller. Getting, the more you interact, the higher the average performance (in terms of conversion).
A third derived in this analysis by the seller might be to know the detail of which seller is the one that interacts and relate to their individual conversion.
CONCLUSIONS
The aim of this article is to share with you the versatility that you have the technology of computer vision, which can deliver different findings to maximize the performance to the interior of a shop, depending on the “pain” that seek to attack (productivity of salespeople, the Layout of the store, hot areas, the gender of your visitors, and everything that a human eye can process).
For the case of this store, it was intended to measure the productivity from the interactions client – seller. We designed the architecture, and applied algorithms able to differentiate a seller for a buyer.
From the data obtained it was found that if there was an optimal time where it was more likely that the visitor will convert into a buyer between (20 – 50 seconds).
In parallel, thanks to the technology, we introduced a new KPI productivity: the amount of interactions average sellers of the store, making determining that the more you interact with your customers, the higher the performance of the store.
A good customer service can make the difference , so if you already know the traffic, conversion, and all indicators “basic” management, but you want to achieve a second derivative in optimizing the interior of your stores, you need to know the optimal time of interaction, together with the productivity of your salespeople.
Author: Tapia, F . Client Account Manager in Intelligenxia

Comments
MariosaB,
31 Mar 2024Bitcoin (BTC) might just be the golden opportunity of our era, poised to skyrocket to $200,000 in the upcoming year or the one following. In the past year alone, BTC has witnessed a staggering 20-fold increase, while other cryptocurrencies have surged by an astounding 800 times! Consider this: a mere few years ago, Bitcoin was valued at just $2. Now is the time to seize this unparalleled chance in life.
Join Binance, the world’s largest and most secure digital currency exchange, and unlock free rewards. Don’t let this pivotal moment slip through your fingers!
Click the link below to enjoy a lifetime 10% discount on all your trades.
https://swiy.co/LgSv